
Environmental
Yearly reduction of 2% in greenhouse gas intensity compared with the baseline year.
Targeting over 90% in total volume of recyclable industrial waste by 2025.
Completing organization-wide greenhouse gas inventory by 2027.
Management System
|
Date of Acquisition | Validity Period |
|---|---|---|
| ISO 9001:2015 | 2024/4/30 | 2027/4/29 |
| ISO 14001:2015 | 2024/5/22 | 2027/5/21 |
| IECQ QC080000:2017 |
2022/1/27
|
2025/2/14 |
| ISO 14064-1 :2018 |
2023/7/26
|
2022/01/01 - 2022/12/31 |
| ISO 14064-1 :2018 |
2024/3/20
|
2023/01/01 - 2023/12/31 |
Issues related to greenhouse gases have gained increasing attention and prompted discussions among businesses and the international community. VIVOTEK has prioritized sustainability and recognizes the potential impact and risks brought by greenhouse gases. We are committed to reducing such impact and contributing to climate change mitigation efforts. The third-party verification statement for 2023 was obtained in the first quarter of 2024. The third-party verification statement for 2024 is scheduled to be obtained in the first quarter of 2025.
Baseline Year: 2023
Inventory Boundary: Zhonghe factory, Taoyuan factory, Taiwan offices, and subsidiaries
| Item | 2021 | 2022 | 2023 |
|---|---|---|---|
| Category 1 (tCO2e) | 87.3350 | 121.8840 | 116.7871 |
| Category 2 (tCO2e) | 1035.4215 | 1832.6397 | 2029.1416 |
| Total Weight of Category 1 and 2 (tCO2e) | 1122.7565 | 1954.5237 | 2145.9287 |
| Category 1 and 2 GHG Emissions Intensity | 0.2059 | 0.1965 | 0.2342 |
| Category 3 – Category 6 (tCO2e) | 195.6384 | 836.5235 | 747.1864 |
Note 1: The 2021 and 2022 data were verified by a third party, AFNOR Asia, Ltd. The 2023 data was verified by BSI with a corresponding statement issued. The verification scope is the same as the inventory scope.
Note 2: The 2023 coefficients are derived from the GWP ratios of IPCC 2021 AR6.
Note 3: VIVOTEK has complete authority over the disclosure of all emission sources within its organization, and therefore adopts an operational control approach for disclosure.
Note 4: If the change in GHG emission data exceeds 3% (significant threshold), the established baseline inventory list will be recalculated and updated according to actual conditions.
Note 5: Greenhouse Gas Intensity = tCO2 / revenue in million (NT$). The revenue was 5,452,000 (NT$) in 2021, 9,948,000 (NT$) in 2022, and 9,162,000 (NT$) in 2023.
Note 6: The gas categories included in the calculation are: carbon dioxide (CO2), methane (CH4), nitrous oxide (N2O), sulfur hexafluoride (SF6), perfluorocarbons (PFCs), hydrofluorocarbons (HFCs), and nitrogen trifluoride (NF3).
Note 7:
Category 3: Indirect GHG emissions associated with transportation. The inventory includes emissions associated with employee commuting and business travel.
Category 4: Indirect GHG emissions associated with products used by the organization. The inventory includes emissions associated with product procurement and waste disposal.
Categories 5 and 6 are owned or controlled by other parties; therefore, these are not quantified.
VIVOTEK's production process does not use process water, ensuring that the volume of incoming water is equal to the effluent volume. The factory and offices are leased while water expenses are shared among the building management committee and rental companies, resulting in minimal water consumption.
To promote water conservation, we implement water-saving measures in our office environment. We have installed sensor-equipped faucets and urinals in restrooms to reduce water consumption. The water consumption in 2023 increased to 37.6094 million liters, compared to 35.8607 million liters in 2022, an increase of 1.7487 million liters, due to the addition of water usage data from new offices in Taiwan, Taoyuan, and affiliated companies.
VIVOTEK implements robust waste management measures, promotes reuse of waste, and collaborates with suppliers to recycle packaging materials and cardboard to promote the development of a green economy. These efforts help delay material disposal and reduce waste. Industrial waste such as plastics, packaging materials, and metal components generated during VIVOTEK's assembly, testing, and packaging processes does not contain hazardous industrial waste.
The Company has dedicated personnel in place to manage and audit waste. Waste is weighed by qualified clearance and disposal organizations, from which the data is transmitted back to the Company, and is handled in accordance with local laws and regulations. The handling methods are recycling, reusing, incineration, and landfill which abide by strict auditing mechanisms to avoid damage to the environment. In 2023, a total of 30.55 tons of waste was processed by qualified clearance and disposal organizations, with priority given to recycling and reuse, followed by incineration and landfill disposal.
Reducing waste starts from within. VIVOTEK collaborates with the supply chain to recycle packaging materials such as cardboard and pallet trays. The percentage of recyclable industrial waste was 98.85%, which is a substantial growth compared to the target set in 2019, i.e. over 90%, indicating a high-level of efficiency; The quantity of recycled trays in 2023 was 5.655 tons; the quantity of classified recycled materials, including components, was 24.5425 tons, resulting in a total of 30.1975 tons of recyclable waste; The quantity of recycled trays in 2023 was 5.655 tons; the quantity of classified recycled materials, including components, was 24.5425 tons, resulting in a total of 30.1975 tons of recyclable waste; No environmental violations or fines reported against the Company in 2023.
Year
|
2023
|
2022
|
2021
|
||||
|---|---|---|---|---|---|---|---|
Classification
|
Disposal Method
|
Output
|
Percentage
|
Output
|
Percentage
|
Output
|
Percentage
|
General Industrial Waste
(Non-hazardous Waste) |
Reusing | 0 | - | 0 | - | 0 | - |
| Recycling | 30.2 | 98.85 | 31.95 | 98.71 | 23.22 | 97.6 | |
| Incineration and Landfill | 0.352 | 1.15 | 0.42 | 1.29 | 0.57 |
2.4
|
|
| Hazardous Waste | None | None | None | None | None | None | None |
Recycled Quantity/Total Waste Quantity
|
Total Waste Quantity | 30.55 | 32.37 | 23.8 | |||
| Proportion of Recycled Waste | 98.85% | 98.69% | 97% | ||||
In 2020, the US branch of VIVOTEK officially utilized a rooftop solar power generation equipment. Nearly 700 rooftop solar panels were installed in VIVOTEK’s office building in San Jose, California. The area of each solar panel is 77x39x1.57 inches. It is estimated that 253,000kWh of renewable energy can be produced through the solar photovoltaic system.
On one hand, the solar panels can help maximize the outputs by independently generating energy from a local power company. On the other hand, it helps save electricity cost, which benefits the utilization of resources and the expansion of operations towards a green business culture. VIVOTEK used renewable energy such as solar photovoltaic and hydropower in 2023. As of the end of December 2023, a total of 2,446,376 kWh green energy and 1,482 renewable energy certificates were purchased, reducing 1,210.96 tons of carbon emissions in total with 46.1% of green electricity in the overall electricity consumption.


Source: Archimedes Mandap
VIVOTEK is dedicated to preserving the ecological environment and upholding its corporate environmental responsibilities. We guarantee that our products and operations comply with international environmental protection laws and regulations, and that our raw materials are sourced from a green supply chain. All VIVOTEK products sold in the market shall comply with environmental protection laws and regulations in every country. We implement preventive green management measures throughout our product design, production, and use to minimize enironmental impact.
Green Supply Chain with Sustainable Commitment
|
||||
|---|---|---|---|---|
| Competent Authority | Management Mechanism | Commitment |
2023 Implementation Projects | 2023 Implementation Results |
| VIVOTEK Jointly managed by R&D, Quality Assurance, and Supply Chain Management Departments |
Corporate Sustainability: Material selection and supplier planning/evaluation |
Re-evaluation every six months for qualified suppliers | Regular re-evaluation every six months |
No suppliers were terminated based on the evaluation results. |
| Audit Confirmation: Corporate sustainability implementation level |
Hazardous substance management and supplier advocacy in compliance with: RoHS EU Directive REACH Regulation Update |
Email and on-site surveys on supplier compliance with international laws regarding environmental protection through random regulatory updates | Survey on existing and new qualified suppliers with 100% response rate in RoHS and REACH |
|
| Actions Taken: Including deadline for improvement and termination of purchase contract |
||||
To ensure sustainable supplier management, VIVOTEK prioritizes integrity, care, innovation, and responsibility. We implement policies that align with the Responsible Business Alliance (RBA) code of conduct, focusing on social responsibility, human rights protection, business ethics, and environmental protection to create a sustainable supply chain. In addition, we prohibit the use of conflict minerals in our products and supply chain materials. Moreover, we continuously work to improve quality, cost, delivery, suitability, and social responsibility among our suppliers. To reduce transportation-related GHG emissions, the Company maintains a localized procurement to support economic development in the region.
Commitment to Supplier Sustainability Management
(1) Prioritize sustainable development as the primary objective of our cooperation
(2) Supply products that contain no conflict minerals
(3) Update supplier roadmap and promote new technology to enhance competitiveness of both parties
(4) Educate suppliers on four aspects: quality, cost, delivery time, and service to facilitate smooth cooperation between both parties
(5) Promote the importance of business ethics, human rights, and sustainability
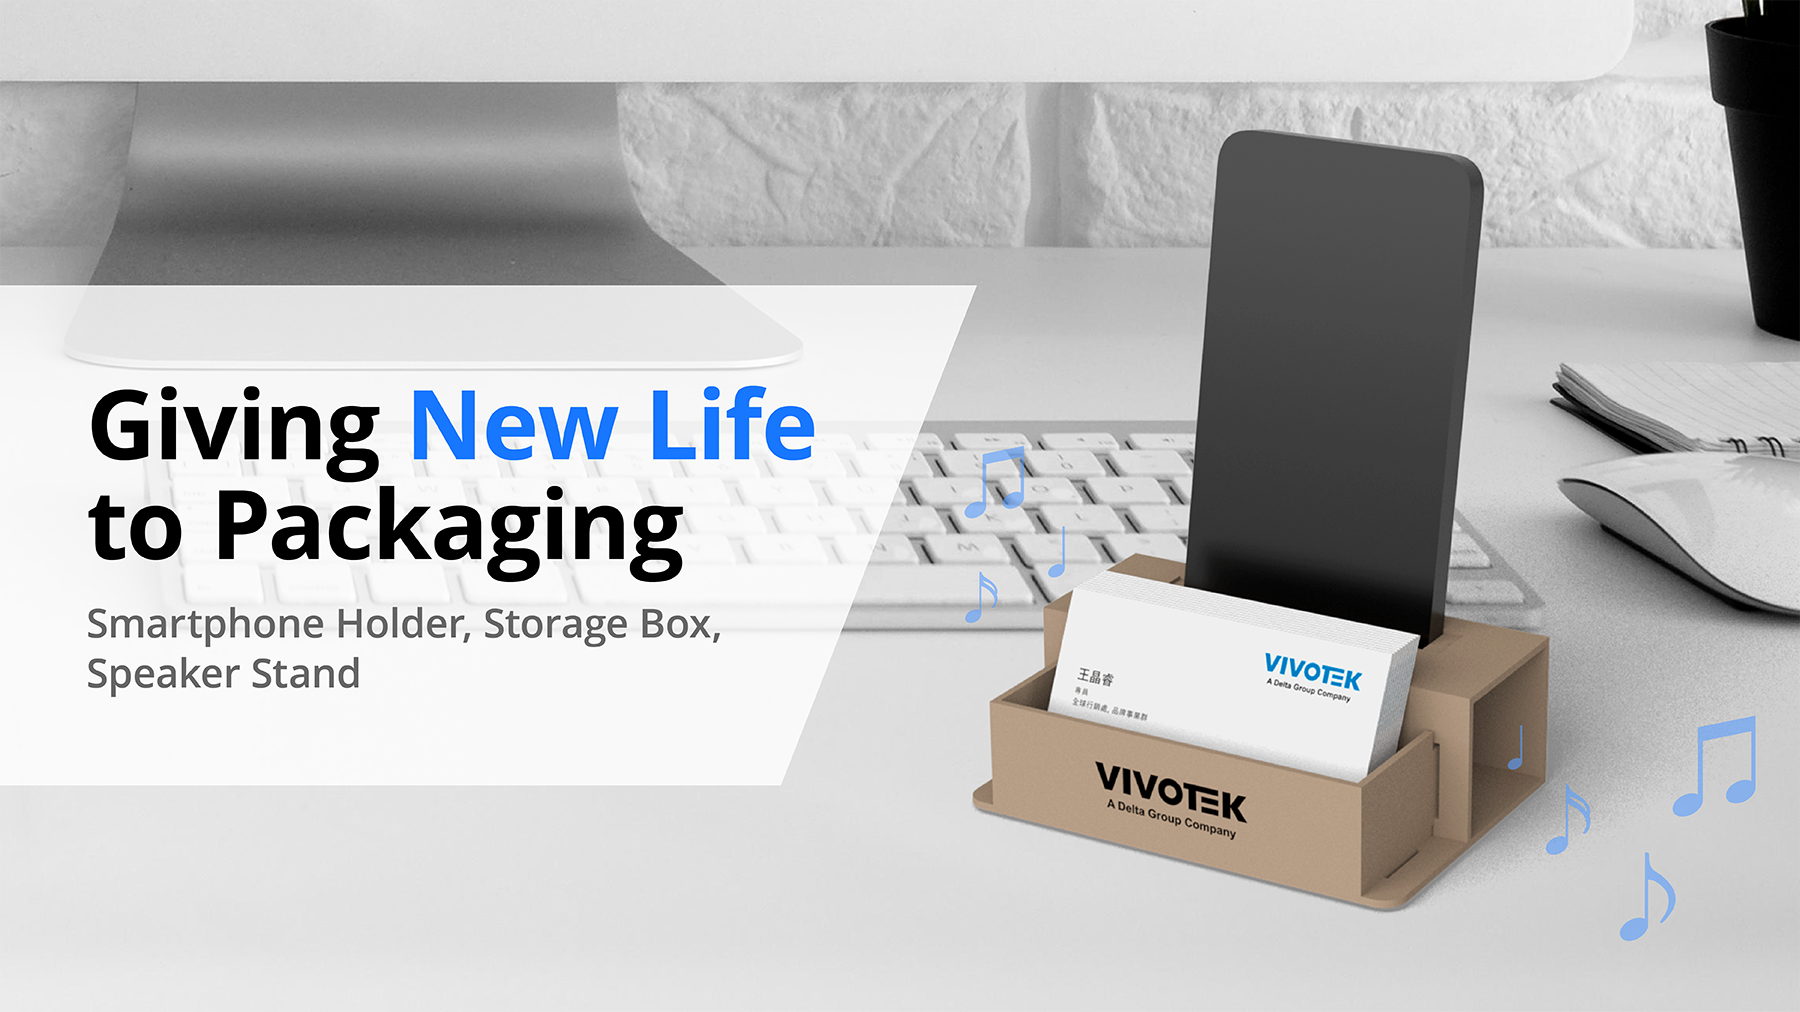
Carbon Emission Comparison:
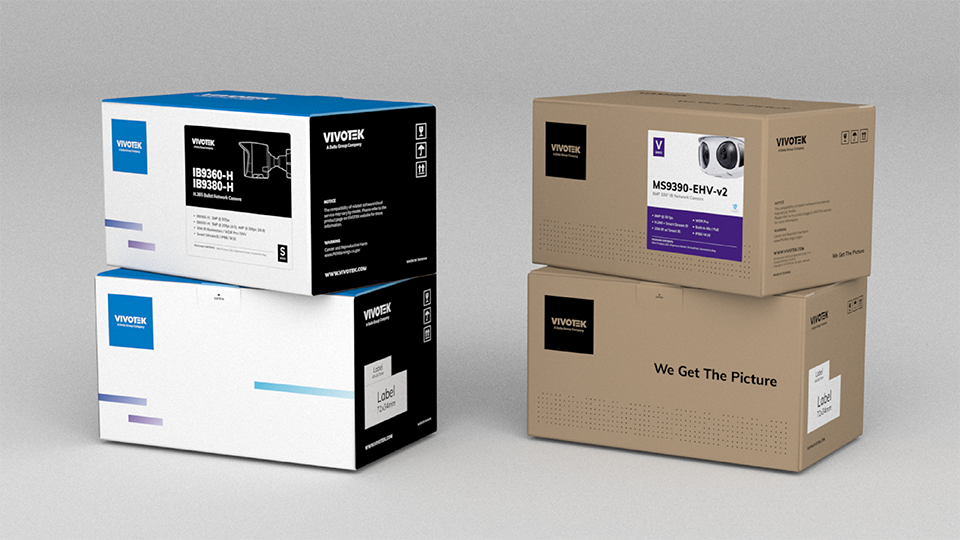
Colored Box vs. Industrial Box
2%
Industrial box emits just 2% of colored box's carbon
1.8
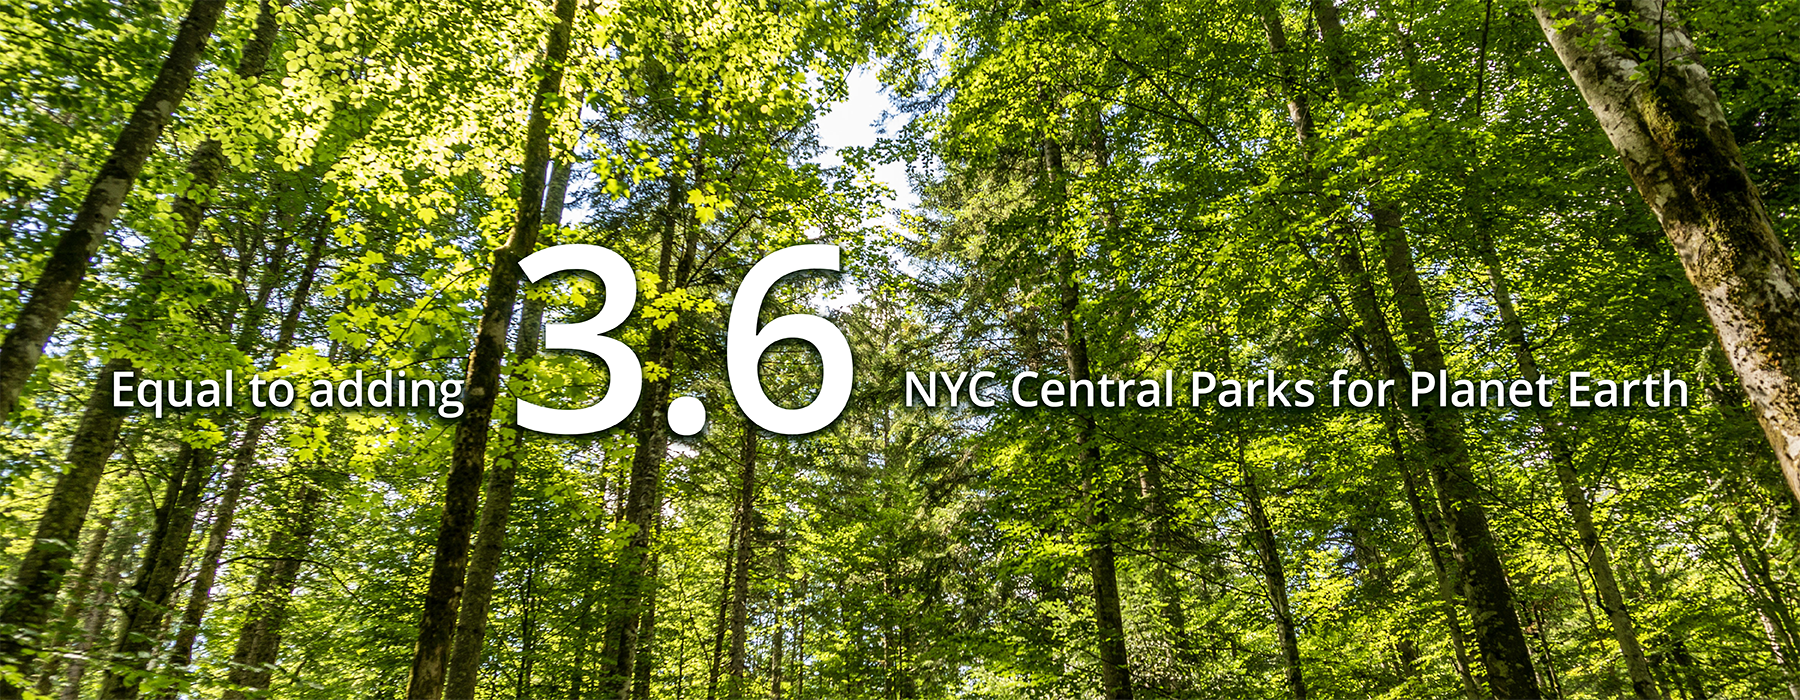
Achieving sustainability: Equals the annual carbon absorbed by 1.8 NYC Central Parks.
Reutilizing Wastes
730,000+
Over 730,000 Units Produced Annually.
46,000Kg
Reutilizing Over 46,000 Kg Annually
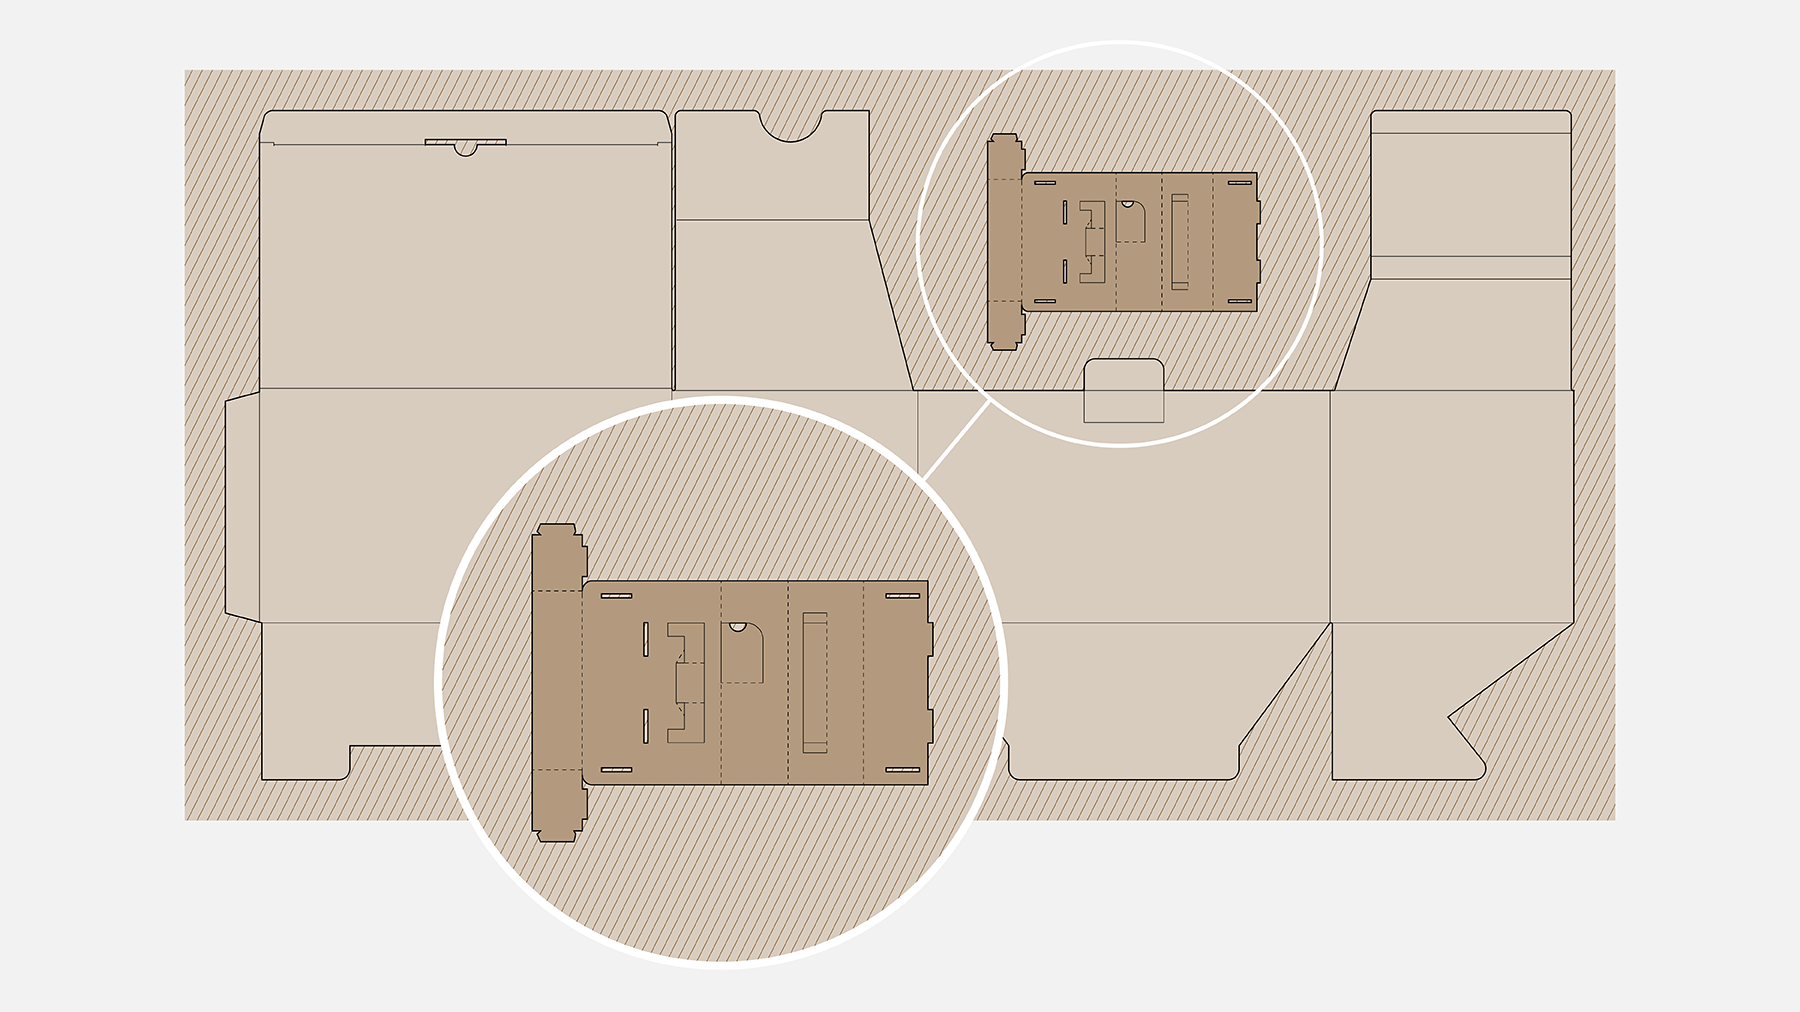
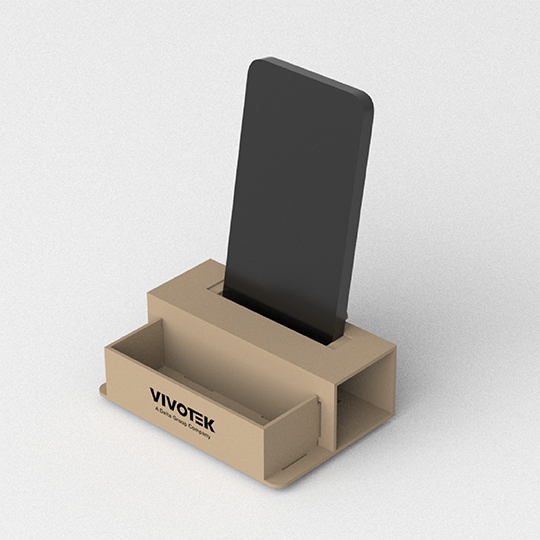
Environmental Consciousness:
Saying No to Plastic Phone Stands
12,000+
Every Plastic Phone Stand Produced Increases Carbon Emissions by Over 12,000g.
1.7
Sustainability Achievement: Equivalent to Annual Carbon Emissions Absorbed by 1.7 New York City Central Parks.
Journey of Sustainability
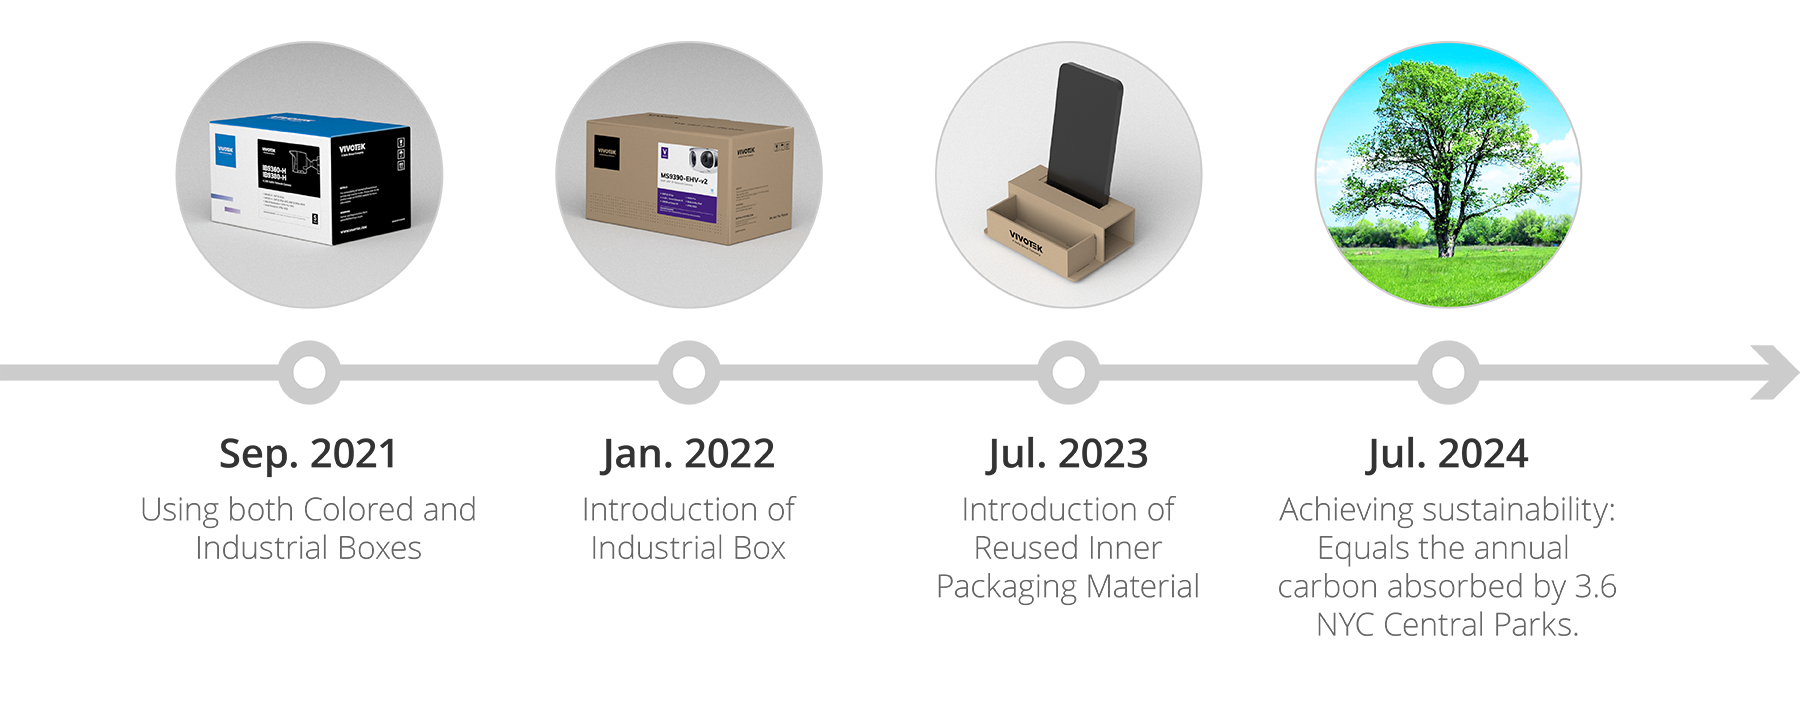
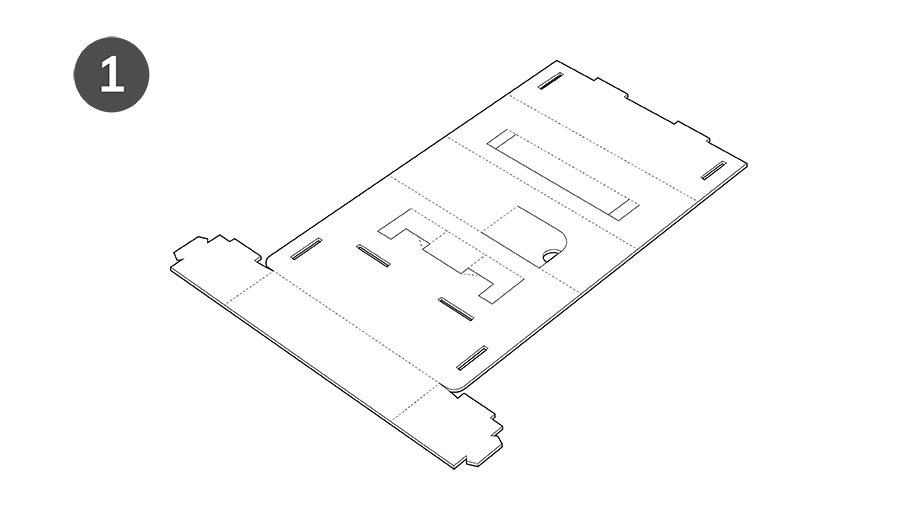
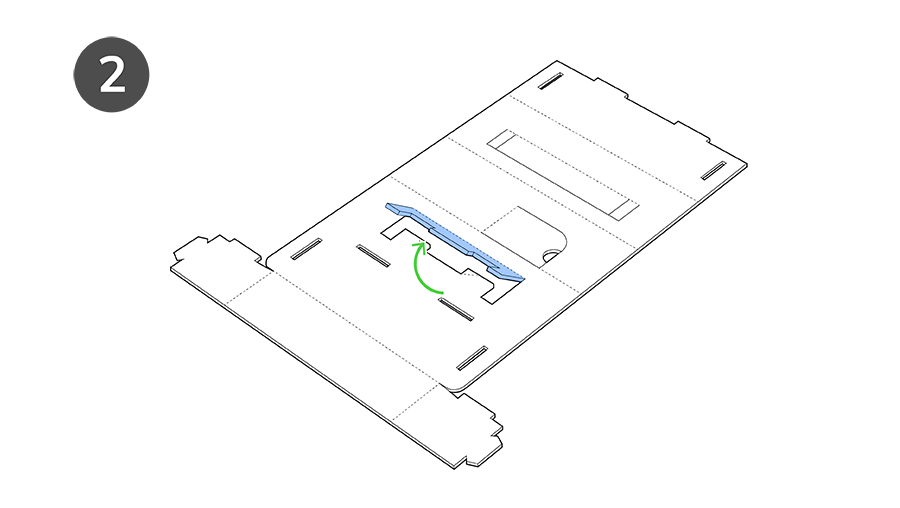
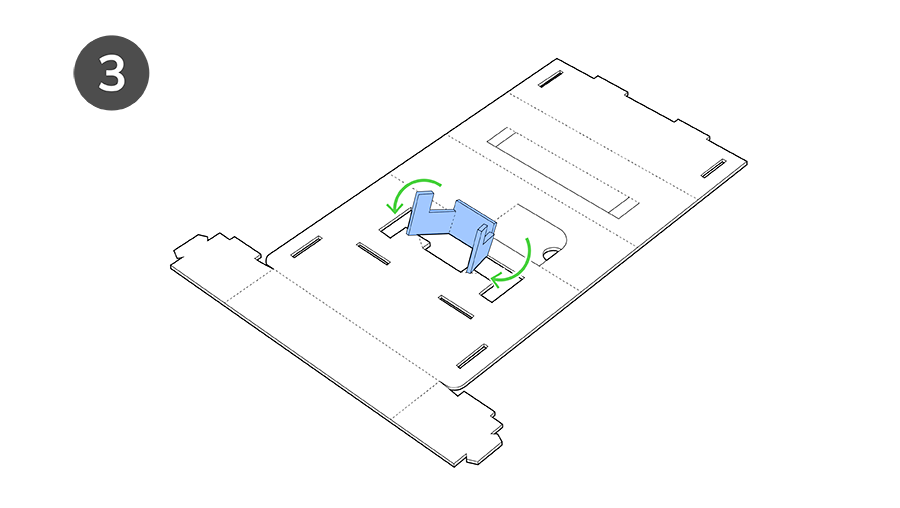
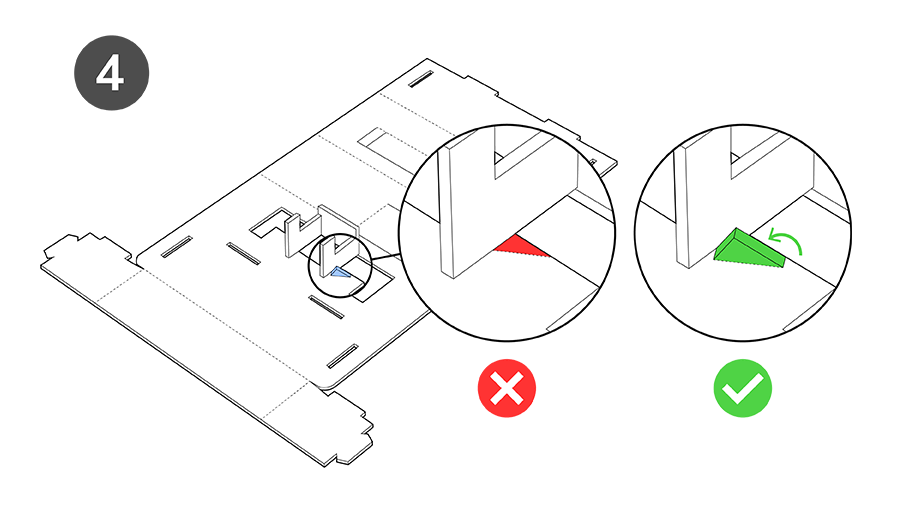
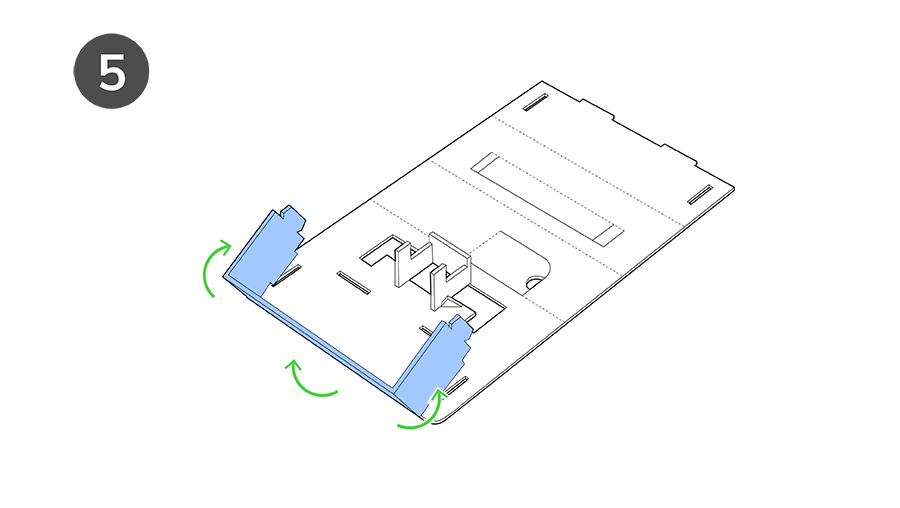
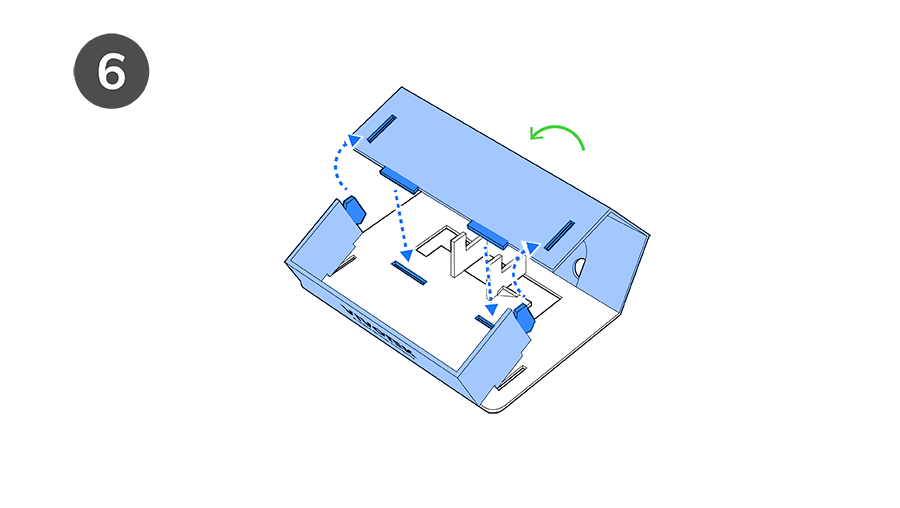
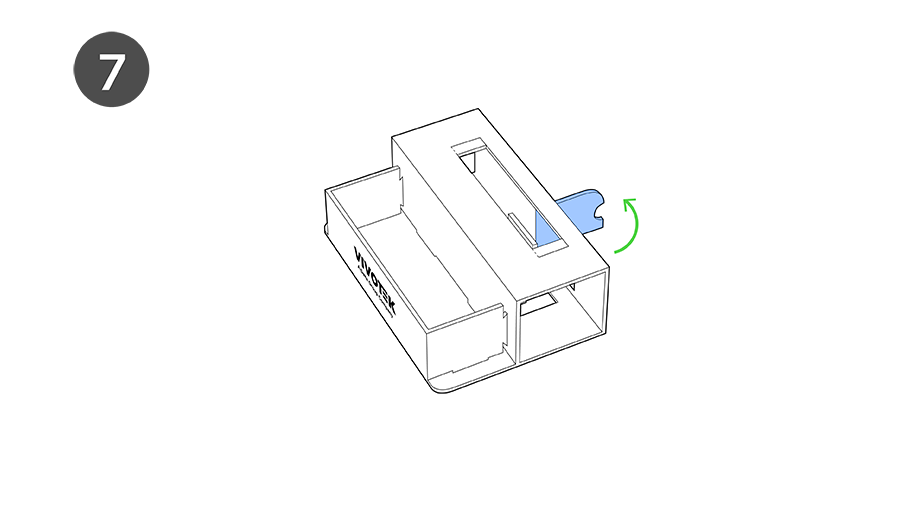
Free and Open Access to Patents
Download Knife Mold-Related Information
For more details on patents, please contact pr@vivotek.com
Note:
- Each gram of PP plastic film produces 407g of carbon; carbon emissions of the colored box are approximately 42,002.6g/unit; carbon emissions of the industrial box are approximately 1,019g/unit.
- Every kilogram of paper box produces 4 kilograms of carbon emissions; on average, over 730,000 packages are used annually; equivalent to reusing 46,000kg.
- Every hectare of forest absorbs 15 tons of carbon emissions a year; in conversion, the 341-hectare New York City Central Park absorbs 5,115 tons of carbon emissions annually.
